Apache JMeter is a powerful tool for load testing functional behaviour and performance of applications over the network. It is however not the most accessible or easy to use tool, mostly because of the overwhelming amount of options. Once started though there is no stopping! We use JMeter primarily to load test our GIS web applications (eg. eBRP) so that we can see if these scale to the sometimes huge amount of concurrent users, in these scenarios we test a web application as a whole, however as we move into a more service oriented architecture we feel a need to test at a smaller scale, ie. the service level. Since many of our map services are exposed with a REST endpoint this is the easiest place to attach our test to.
A common way of working with JMeter is to record one or more typical sessions using the JMeter built-in proxy and recording function, these are then edited so they can be parametrized with user credential and session information. When starting a recording session you must start off with a simple scenario, if you don’t you’ll just get lost in the amount of information that is recorded.
For testing our mapservice we can basically follow the same procedure; using the ArcGIS server built-in JavaScript viewer or a simple test application we can record a user session. The result is then (in this case) parametrized so we can look at random locations on the map and do identify operations at random locations., to initially go to a random location we have a list of 100 address locations (zip;number;x coordinate;y coordinate) in a .csv file that have been randomly drawn from our address database. Then we put in some elements called BSF PreProcessors that will do some simple calculus in JavaScript to determine bounding boxes and such as shown below.
// retrieve wkid and bboxSize
var wkid         = parseInt(vars.get('wkid'),10);
var bboxSize     = parseFloat(vars.get('bboxSize'));

// randomize zoomfactor, bboxSize
var randomnumber = 1+Math.random();
var zM           = 5*randomnumber*bboxSize;

// resize bbox
var xmin = parseFloat(vars.get('xmin')) + zM;
var xmax = parseFloat(vars.get('xmax')) - zM;
var ymin = parseFloat(vars.get('ymin')) + zM;
var ymax = parseFloat(vars.get('ymax')) - zM;

// store in memory
vars.put('xmin',xmin);
vars.put('xmax',xmax);
vars.put('ymin',ymin);
vars.put('ymax',ymax);
vars.put('bbox','{"xmin":' + xmin + ',"ymin":' + ymin + ',"xmax":' + xmax
              + ',"ymax":' + ymax + ',"spatialReference":{"wkid":' + wkid + '}}');
log.info('bbox updater zoom in: ' + vars.get('bbox'));
Next up is adding some expectations that we want to be fulfilled, eg. we want to have all responses a HTTP status code of 200 (which means OK), we want image request to have the proper mime type (ie. a png8 image should be returned with ContentType: image/png and we are expecting certain response times). These are set up by adding Response Assertions to our JMeter script.
Now we can add some advanced options such as Logic Controllers and Timers to further randomize the load and number of sessions to our service. And finally we want to have our results so we add in some Listeners such as graphs and tables. These Listeners can also be used to export the test results to an XML or CSV formatted file or an image.
Get going
So get started, download JMeter and load the script (.jmx) attached to this post. Get a list of point data in a csv file (the attached .csv is in Rijksdriehoek / EPSG:28992 which may or may not be useful to you), when you use your own you may need to tweak the format in the “CSV Data Set Config - adressen”, also you probably also need to tweak some of the JavaScript code in the preprocessors as these are based on a regular grid in meters. I guess if your data is in UTM you should be fine.
You need to specify/adapt the parameters in the test plan (users, iteraties, mapPath, gisHost, gisPort, wkid, fullExtent and zoomExtent) to suit your mapservice. To start off choose a small number for both users and iteraties such as 1. You should now be ready to go…
Download JMeter script .zip.
Interpret Results
JMeter really doesn’t know what you’re using it for, so interpreting results is sometime a challenge in itself. There are some Timeout parameters (assertions) that you can adjust to specify minimum thresholds for response times and there’s a large number of Listeners that will help you visualize the results or export them to something like CSV which you can then use in you favourite spreadsheet or reporting tool.
A sample Run
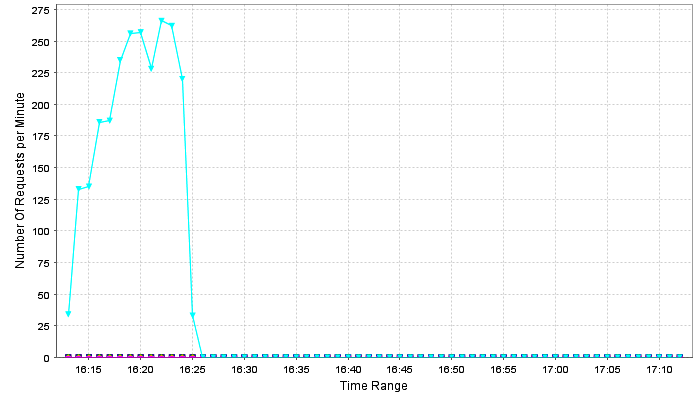
Using the posted .jmx I ran a test on one of our development test servers, these are virtualized dual cpu win2003 systems running on esx; they are not production grade systems. Below you can see some of the results of an optimized mapservice (.msd) containing an aerial photograph of the Netherlands stored in a 24x7 oracle10 database from our production environment. I have set up the testplan to use 50 users with 10 iterations each and a rampup time of 900 seconds using only the map requests (not the identify); JMeter unfortunately didn’t quite make it to the end of the test due to a memory errror, so this needs to be tweaked a bit in the startup script of JMeter; it’s likely the result of all the listeners in the .jmx so you may want to disable one or two of them.
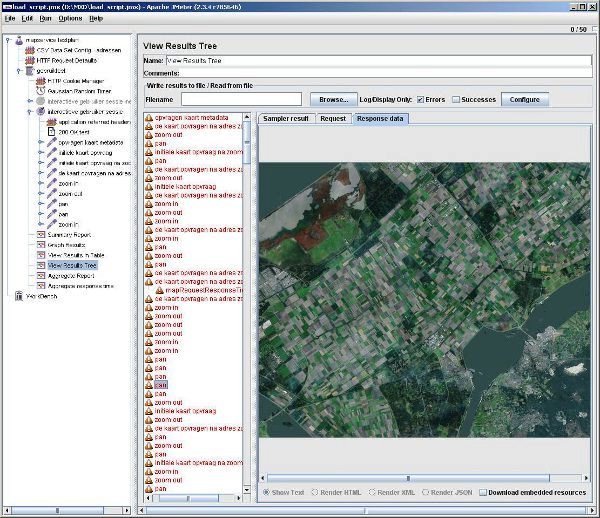
In the results tree shown in the first screen capture I have only logged the errors; these are erroneous because the response took too long to load (more/longer than the mapRequestResponseTimeMillis set at 950 ms).
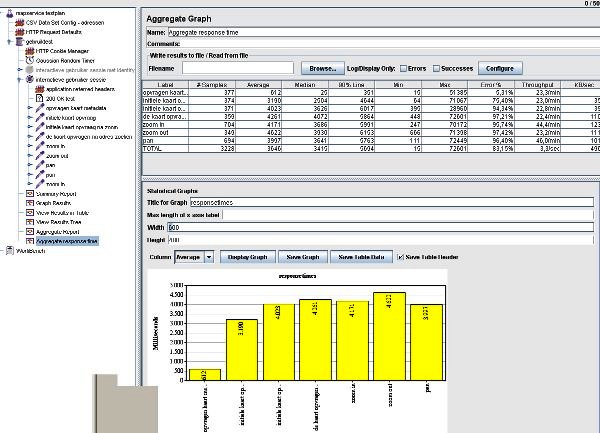
In the second screen capture you can see the aggregate results of the testrun, which clearly shows that it takes longer to get a more detailed part of the map from the database.
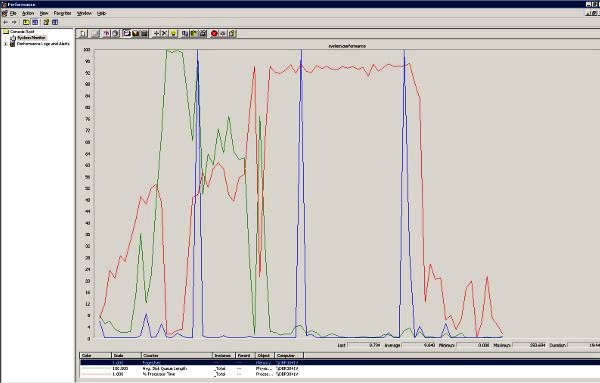
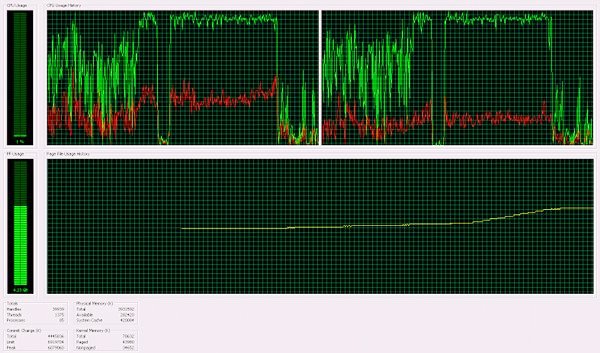
The test is incomplete without also monitoring the server. There are a number of built-in tools for windows, such as Perfmon and of course the taskmanager.In my set up I noticed a competition between the two SOC processes running the map and the Java process running the servlet engine that runs the REST interface, each of the managed to get up to 1/3 of the total available CPU.
ArcGIS Manager also provides some graphs showing throughput.
This post was previously published on GISpunt.