The Inspire directive has some fairly strict requirements regarding performance and uptime of services (QOS) (see: 32009R0976 Annex 1 and the amendment. Monitoring these parameters can easily be done using a few Python scripts and RRDtool. This provides an environment that is both lightweight and portable across platforms.
RRDtool has been around for ages and is a de-facto instrument for lightweight logging systems gathering large amounts of data. The database aggregates the input providing various algorithms such as average, max/min value as well as way more complex methods. The aggregation makes it possible to use the same database for years while the file size stays constant and the amount of information just keeps growing. Current versions of RRDtool provide Python bindings out of the box, however I chose to use PyRRD because I was unsuccessful compiling them using Visual Studio 10 first time around.
I have chosen to monitor performance based on response time (the time needed for the initial byte to be received) and transfer time (the time needed for the last byte to be received).
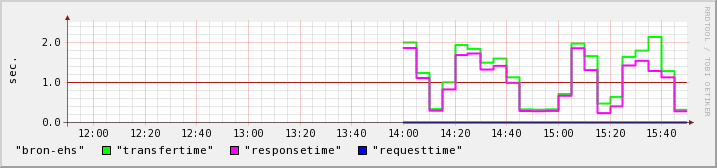
To prevent caching of the image a pseudo random bounding box and image size are used so that each request is unique, this generates some variance in the response size so the amount of data transferred (total bytes) for each request is also logged.
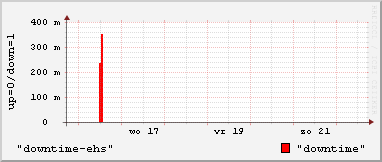
Next to that uptime is monitored based on the correct mimetype of the GetMap response, the assumption here is that a mimetype other that requested means there was an error in the service, thus un-availability, this is a rather coarse approach, but it works for me because there is a separate error log that provides the details of a failure.
I have a batch file that runs the probe script every five minutes and create a graph every fifteen minutes, a HTML page is used to display the resulting graph as wel as provide access to the logfile and the last request.
This post was previously published on GISpunt.